Cloudbreak Weather — User guide
The complete guide to Cloudbreak. Walkthroughs are shown on iPhone; the app works the same on iPad and Mac, with a companion Apple Watch app and widgets. Use the contents to jump around.
Getting started
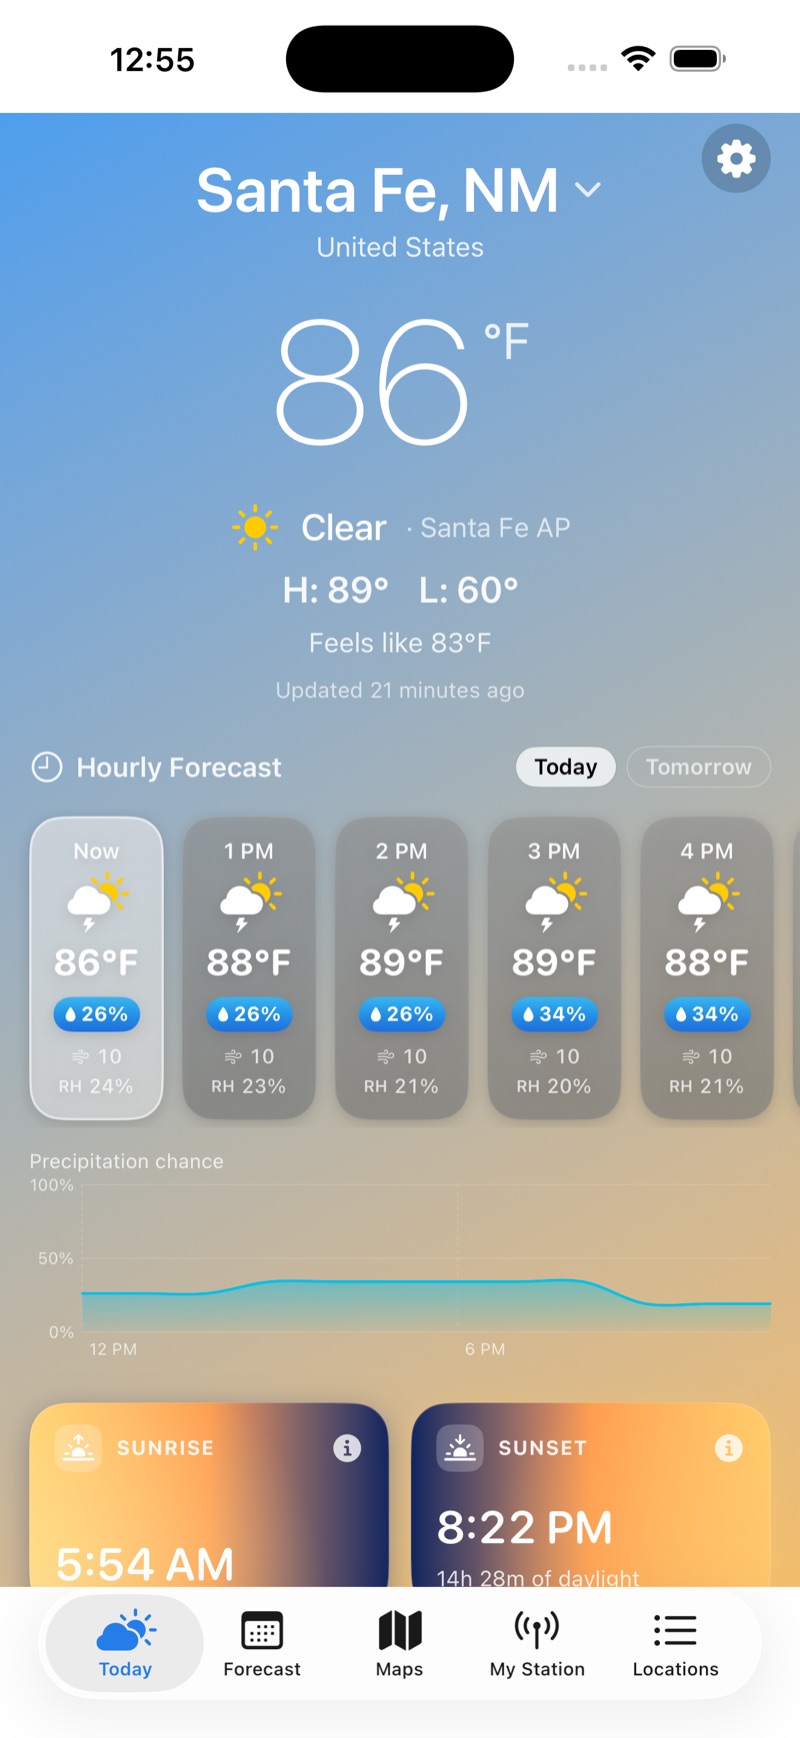
On first launch, Cloudbreak asks to use your location. Allow it and the Today tab shows the weather where you are. While it gets a fix you'll see "Locating…"; if you skip permission you'll see "Your Local Weather" with a Use My Location button; and if location is off, "Location Is Off" with Open Settings.
If you haven't saved anything yet, the Locations tab shows "No locations yet" with an Add Location button. Everything in Cloudbreak revolves around your current location plus the places you save.
Finding your way around
Cloudbreak is organized into five tabs along the bottom (a sidebar on iPad; the same tab bar on Mac):
- Today — current conditions and the hour-by-hour detail for the selected place.
- Forecast — the 7-day forecast and the forecaster's discussion.
- Maps — radar, satellite, wind, temperature, and a dedicated fire map, with Lightning and Air-Quality overlays.
- My Station — live readings from your own weather station.
- Locations — your saved places, search, and Settings.
To switch between places:
- On Today, swipe left or right, or tap the place name at the top (it has a small ▾) and pick from the Switch location menu.
- On Forecast and Maps, use the place menu in the toolbar.
- Or open the Locations tab and tap any place. Changing places keeps you on the tab you're already viewing.
- Pull down on the Locations list to refresh.
- On Mac, the place switcher sits in the window toolbar, with edge chevrons to move between places instead of swiping.
Adding & managing locations
Open the Locations tab to manage your places. From here:
- Add a place: type in "Search city, town, or address" (powered by Apple Maps — cities, addresses, and landmarks all work, e.g. "Albuquerque", "1 Apple Park Way", "Grand Canyon"). Tap + on a result to add it straight away, or tap the result to preview its forecast and then tap Add.
- Save where you are: on the Today tab, tap the + next to the current-location name. If it matches a place you've already saved, Cloudbreak keeps just one.
- Current Location is always the top row; your Saved places follow, each showing its conditions and high/low.
- Rename a place: swipe its row right and choose Rename Place.
- Remove a place: swipe its row left and tap Remove.
- Reorder: tap Edit, then drag your places into the order you want.
New installs start with just your current location — there are no pre-loaded cities, so the app only ever shows places you choose.
Your forecast in detail
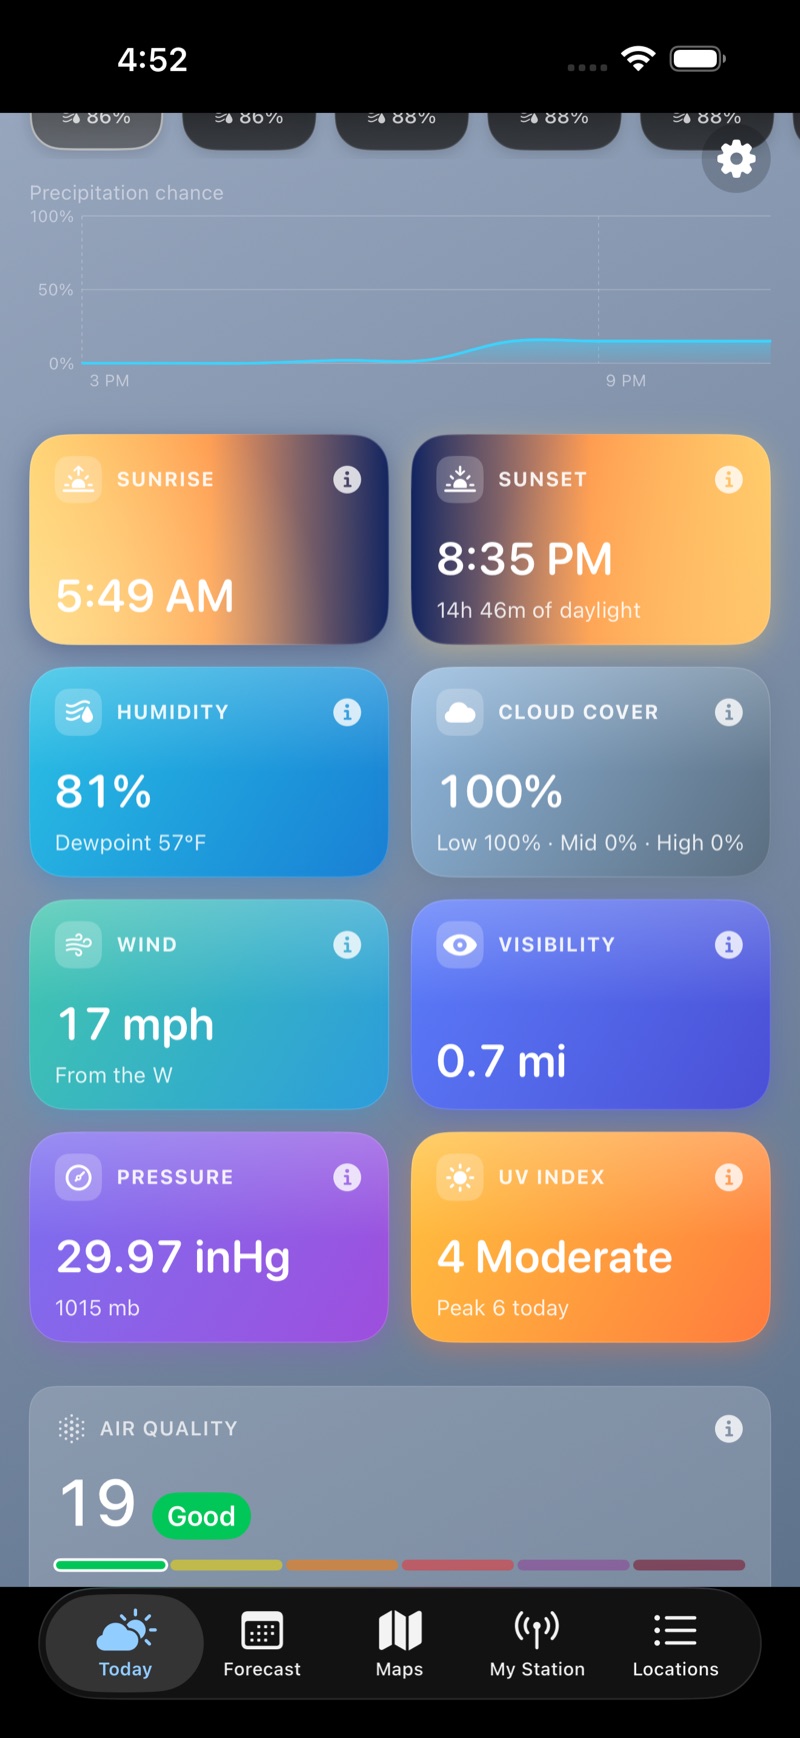
The Today tab scrolls from the big picture down to the details:
- Top: the current temperature, condition, today's H: / L:, and Feels like (shown when it differs). A small tag names the observation source (e.g. "· Santa Fe AP"), and if one of your weather stations is nearby an antenna chip shows it's the source. A reading that has gone stale is dimmed and labeled "Updated … ago."
- Hourly Forecast: up to 36 hours; switch between Today and Tomorrow. Each hour shows its temperature, a precipitation chance, wind, and relative humidity (RH), and a Precipitation chance chart plots the next several hours on a true 0–100% scale.
- Detail cards for every condition (below).
- Cross-links to Air Quality, Fire Weather, and the Almanac.
The 7-day forecast and the forecaster's discussion now live on their own Forecast tab — see the next section.
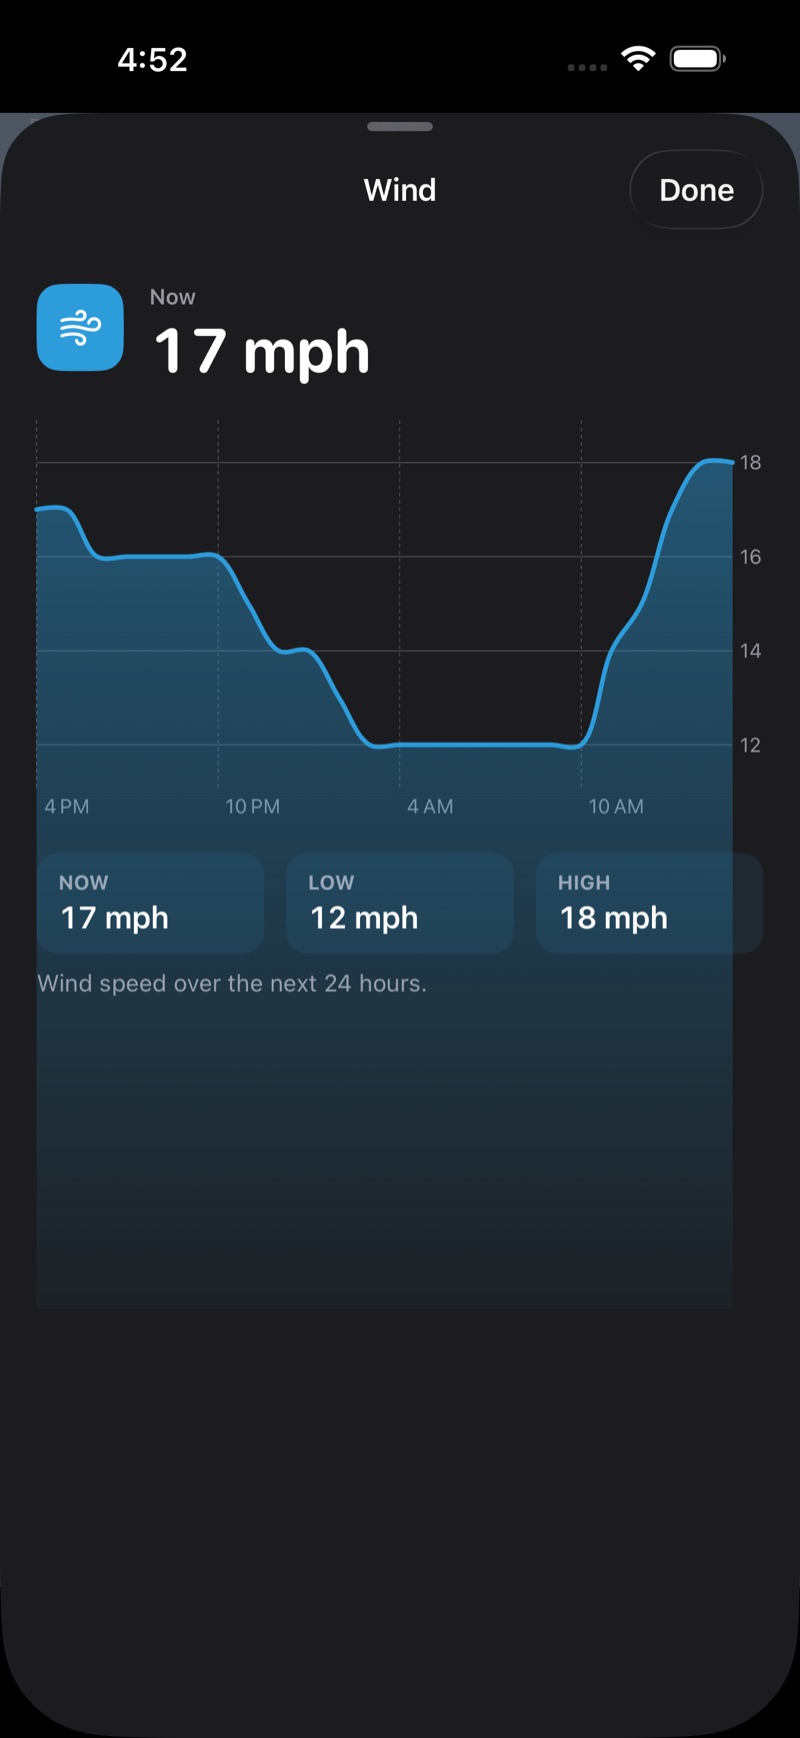
Tap any detail card to open a 24-hour chart you can drag to scrub, with NOW / LOW / HIGH readouts. The cards are:
- Sunrise and Sunset — open an interactive Sun arc (drag the sun through the day, with the length of daylight).
- Humidity, Cloud Cover, Wind, Visibility, Pressure, UV Index, and Feels Like — each opens its 24-hour chart. Cards appear only when that data is available.
The 7-day forecast
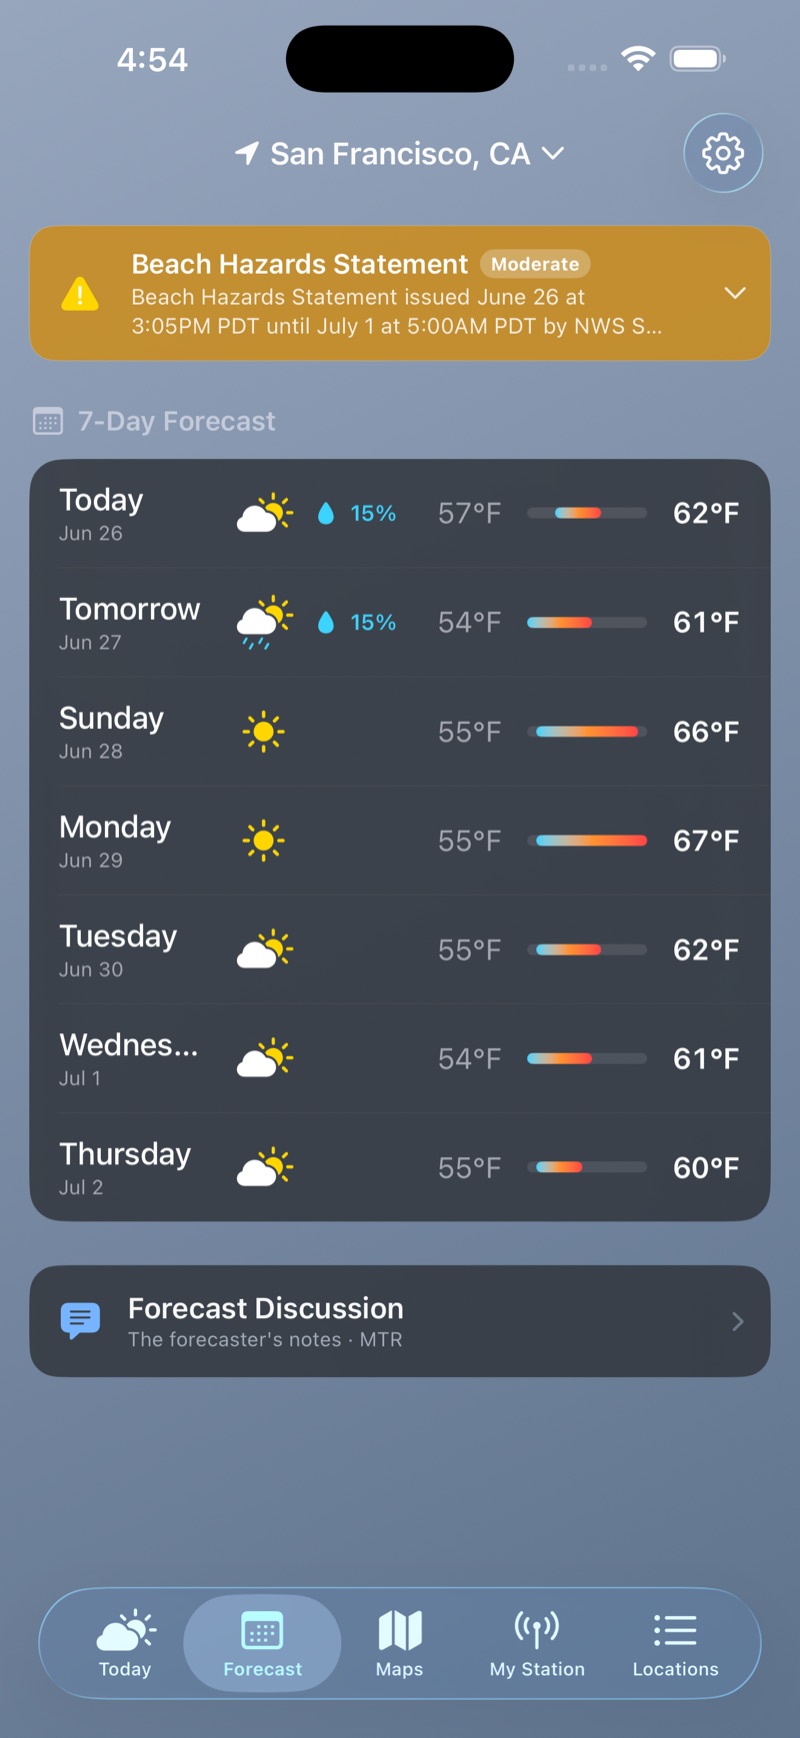
The Forecast tab is your week ahead:
- 7-Day Forecast — each day shows its date, the icon, a chance of rain, the low and high, and a temperature range bar. Tap a day to expand the National Weather Service day-and-night wording and winds.
- Forecast Discussion — opens the local NWS forecaster's own notes (the Area Forecast Discussion) for the reasoning behind the numbers.
Fire-weather
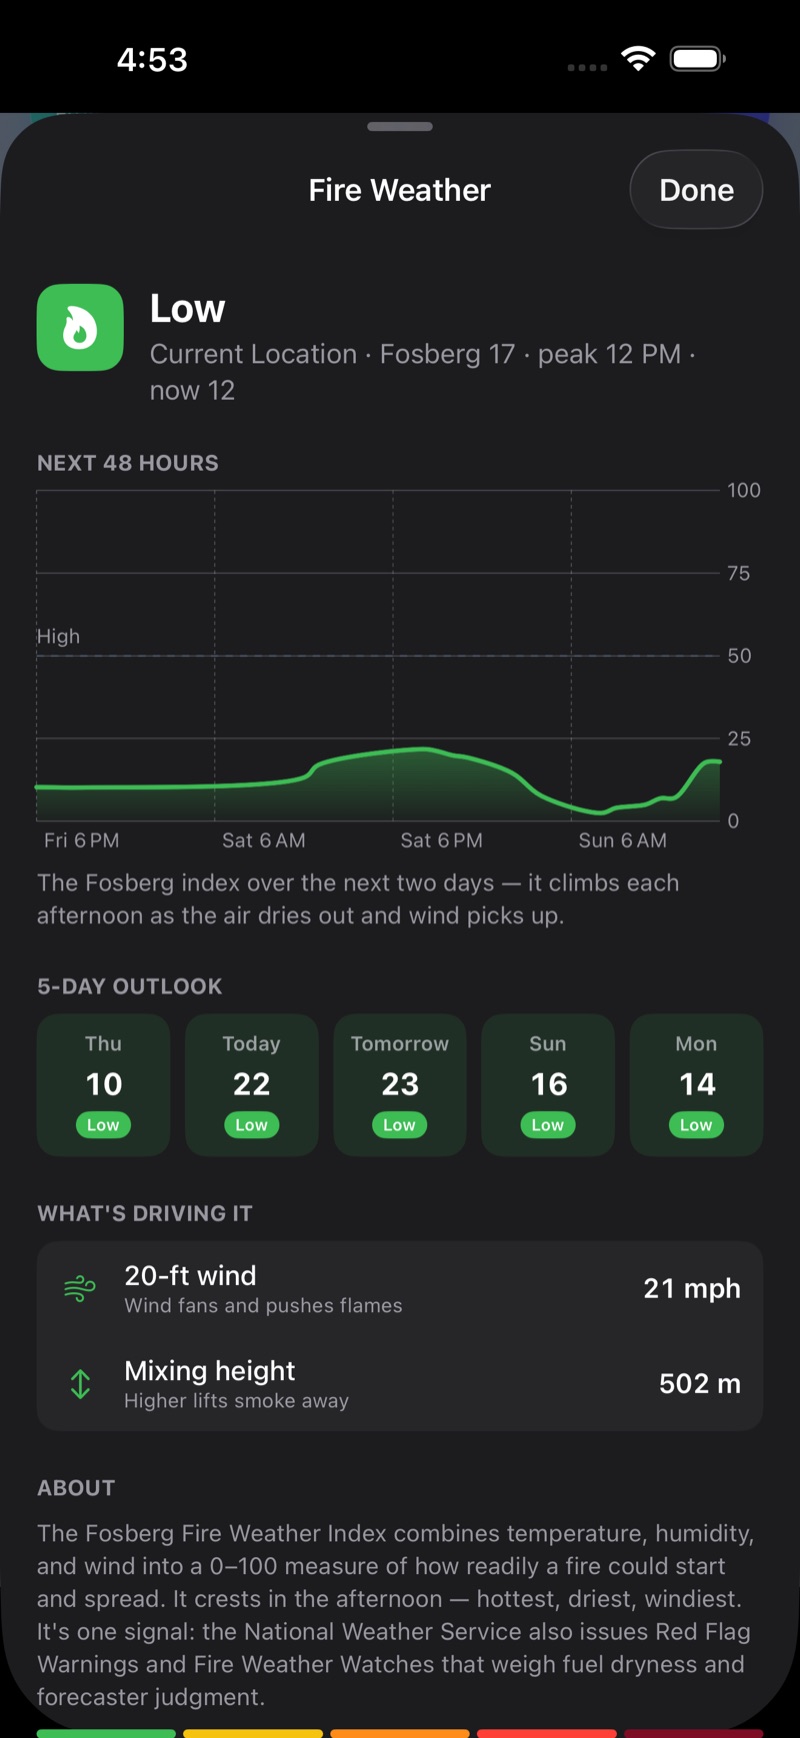
Tap the Fire Weather card on the Today tab for the full read:
- A daily risk band — Low, Moderate, High, Very High, Extreme — based on the Fosberg fire-weather index.
- A Next 48 Hours chart and a multi-day outlook.
- What's driving it — minimum humidity, 20-ft wind, the Haines index, and mixing height.
- An About explainer and the five-band scale.
Fire-weather works wherever you take Cloudbreak. In the United States the read comes from the National Weather Service's fire-weather grid; elsewhere — including Canada — Cloudbreak computes a Modeled estimate (from Open-Meteo) and labels it as such, so you always know which one you're looking at. The official Haines, minimum-humidity, 20-ft-wind detail and Red Flag handling are part of the U.S. data.
Red Flag Warnings and Fire Weather Watches stand out in the alerts banner and can trigger a notification (see below).
Air quality
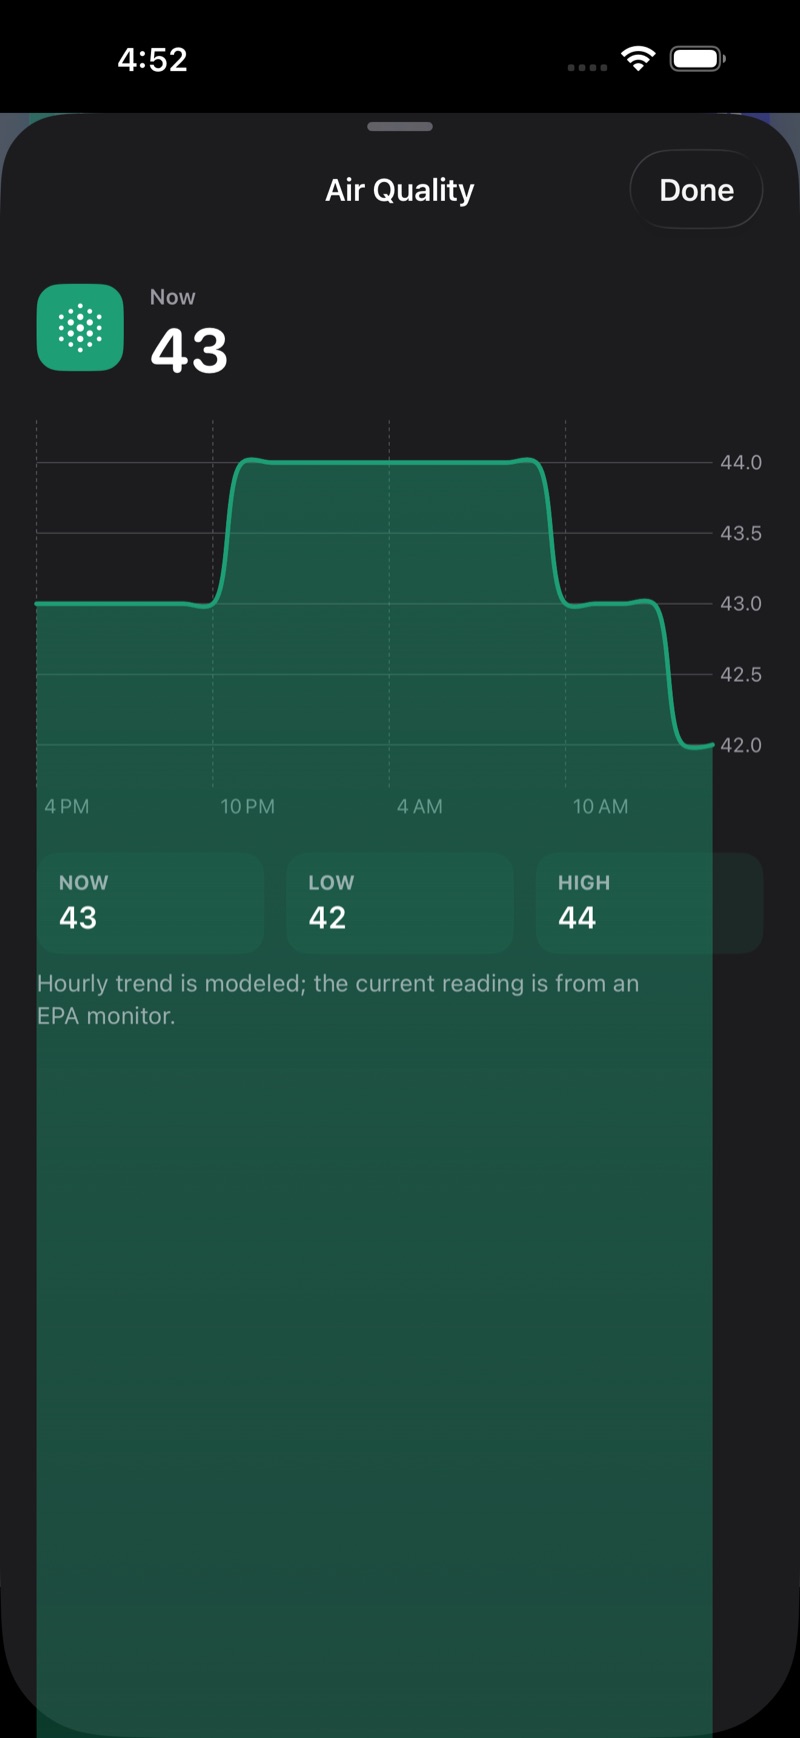
Two cards on the Today tab cover air quality:
- Air Quality — the current US AQI with a band from Good to Hazardous. Cloudbreak tells you where the number comes from: a nearby EPA AirNow monitor (labeled "EPA AirNow · {your area}") or, where there's no monitor, a Modeled estimate. Tap it for a 24-hour AQI chart.
- Air Quality Outlook (EPA AirNow, US) — a day-by-day outlook with an Action Day flag when relevant.
The maps
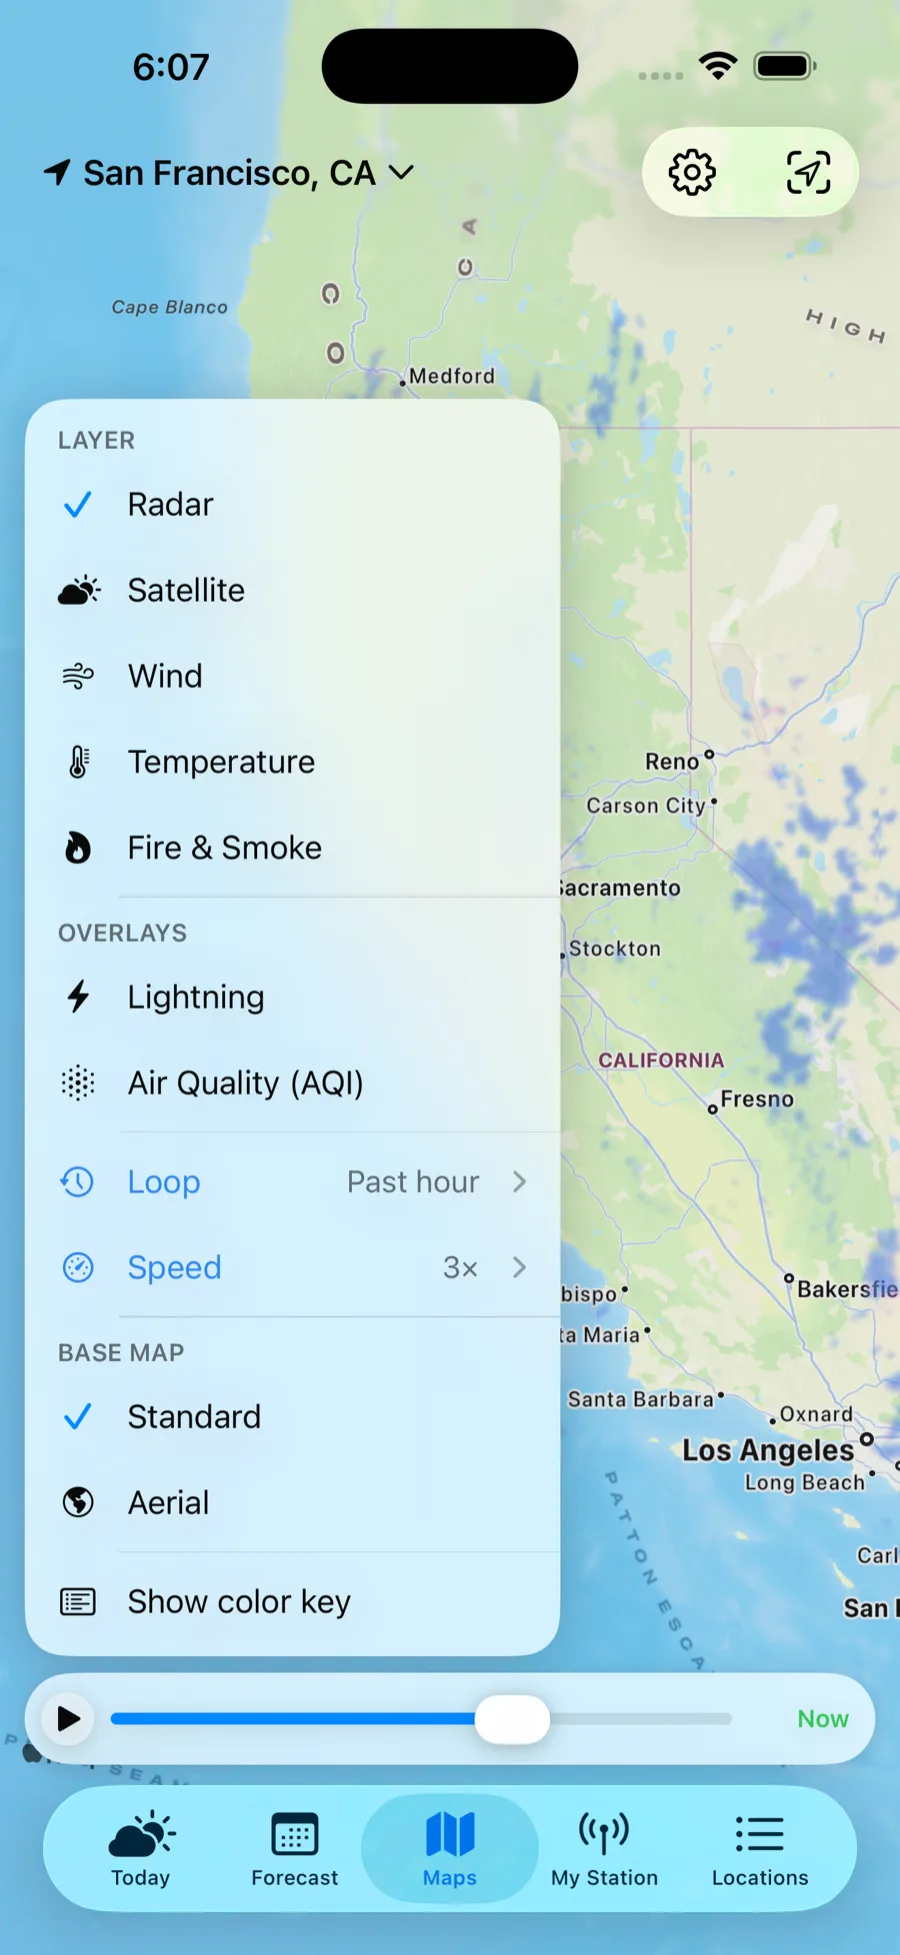
Open the Maps tab and the layer menu opens for you — one floating panel with everything in it. Choosing a layer closes the panel; toggles leave it open. Nothing heavy loads until you pick something, so Maps opens instantly.
- Layer — pick one: Radar, Satellite, Wind, Temperature, or Fire.
- Overlays — add on top of any layer: Lightning (strike density) and Air Quality (EPA AirNow monitor pins).
- Loop — how much of the timeline to load (Radar and Satellite).
- Speed — how fast to play it (Radar only).
- Base map — Standard or Aerial (satellite imagery) beneath the data.
- Show color key — opens a card explaining the colors and crediting the source.
What each layer shows:
- Radar — high-resolution precipitation across the U.S. and Canada, seamless across the border, running from the recent past straight on into a short-range forecast. It's one continuous timeline: drag back through the last hour or two, or push past now to see where the rain is headed. Forecast frames are marked by an orange time readout, and a small tick on the scrubber shows where now sits. Set Loop for how far back to load, and Speed for playback (0.5× to 4×).
- Satellite — GOES imagery you can replay over the last 6 or 24 hours (true color by day, infrared at night). Satellite looks backwards only, and the newest frame runs roughly an hour behind real time.
- Wind — a flowing surface-wind field; tap anywhere to read speed, gusts, and direction.
- Temperature — a live surface-temperature map; tap to read the current air temp at a spot.
- Fire — the dedicated fire map, with its own section below.
Playback sits in a floating bar: play/pause, a scrubber you can drag, and the time of the frame you're on. It opens paused on now, so nothing moves until you ask it to. Legends collapse to keep the map clean. Use Recenter to jump back to your location, the + / − buttons or pinch to zoom. On Mac, use the edge chevrons to change location.
The fire map
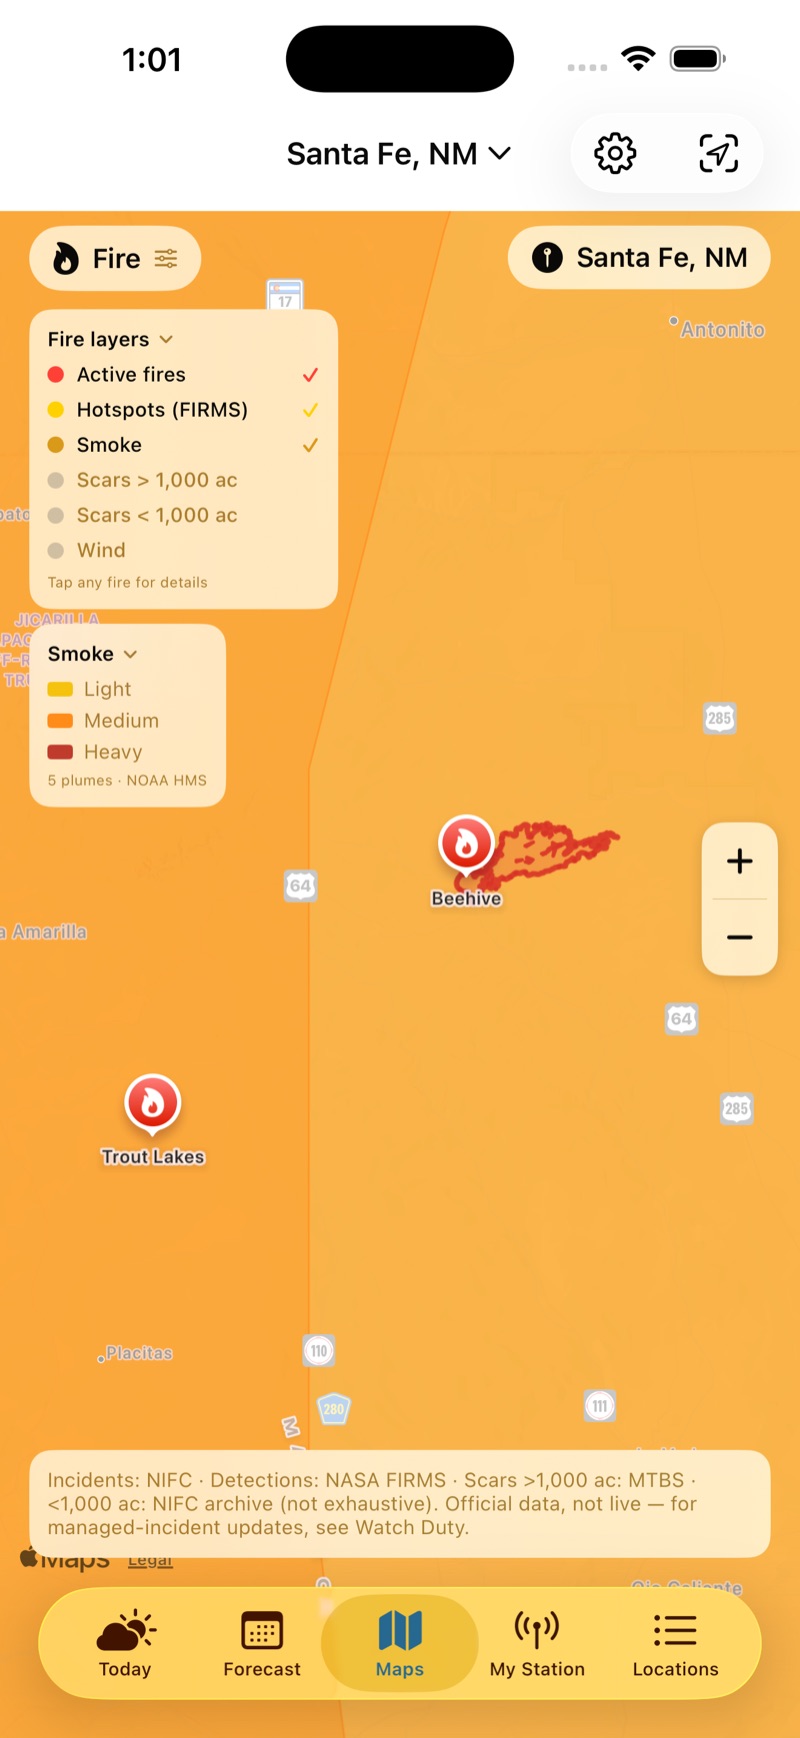
In the layer menu, choose Fire for everything wildfire on a single map. A Fire layers checklist appears in the menu whenever Fire is the active layer, turning each kind of information on or off — combine them however you like:
- Active — named wildfire incidents and their perimeters, tinted by stage (active, contained, controlled, out). On by default.
- Hotspots — satellite heat detections from NASA (FIRMS) over the last few days. On by default.
- Smoke — NOAA smoke plumes. On by default.
- Scars > 1,000 ac and Scars < 1,000 ac — historical burn scars from two sources: the authoritative USGS/USFS burn-severity record (MTBS) for the larger fires, and the interagency NIFC archive (not exhaustive) for the smaller ones. Prescribed burns draw in cool slate, wildfire scars in warm brown. Off by default.
- Wind — a dimmed wind-direction underlay showing which way a fire could spread. Off by default.
Tap any pin for a detail card (it shows only the fields that exist): an incident gives its size, containment, timeline, cause, fuel and behavior, complexity, personnel and managing organization, cost, and when it was last updated; a hotspot gives the detection time and confidence, with a note that it's a satellite heat signature, not a confirmed fire; a burn scar gives its name, year, and size.
Almanac & history
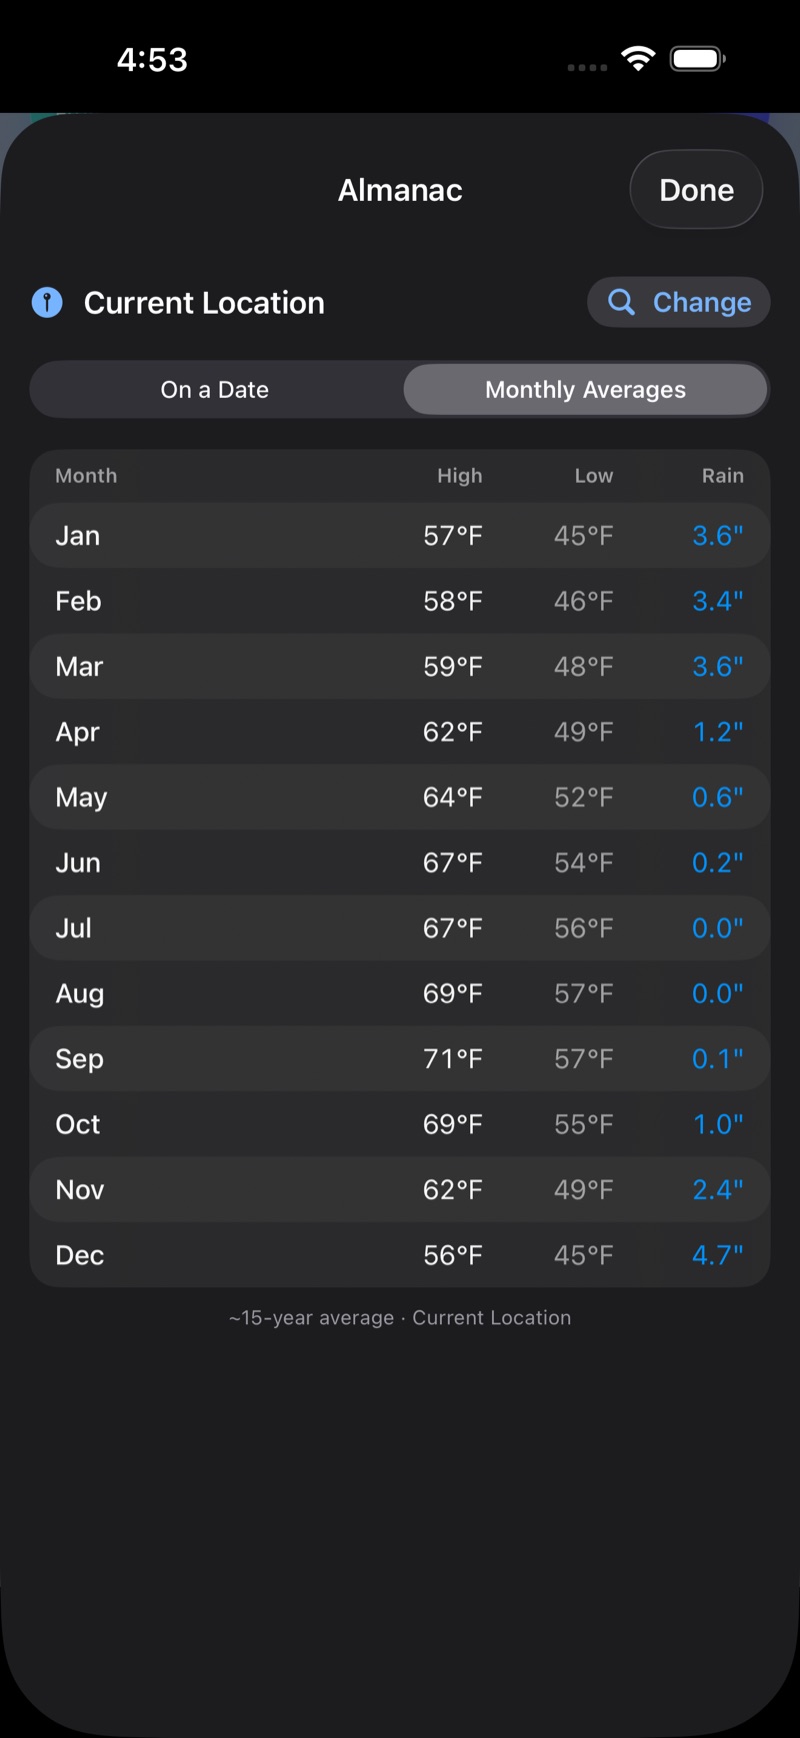
Open the Almanac from the link on the Today tab to look back, not just ahead. The Mode switch offers:
- On a Date — pick any past date to see that day's high, low, rainfall, and maximum wind. The archive reaches back to 1940 and runs about 5 days behind the present.
- Monthly Averages — a month-by-month table of typical highs, lows, and rainfall, drawn from roughly 15 years of record.
Tap Change to look up a different place.
Rainfall in the Almanac is always shown in inches. Looking for sunrise, sunset, or the length of the day? That lives on the Today tab's Sun arc, not the Almanac.
Your own weather station
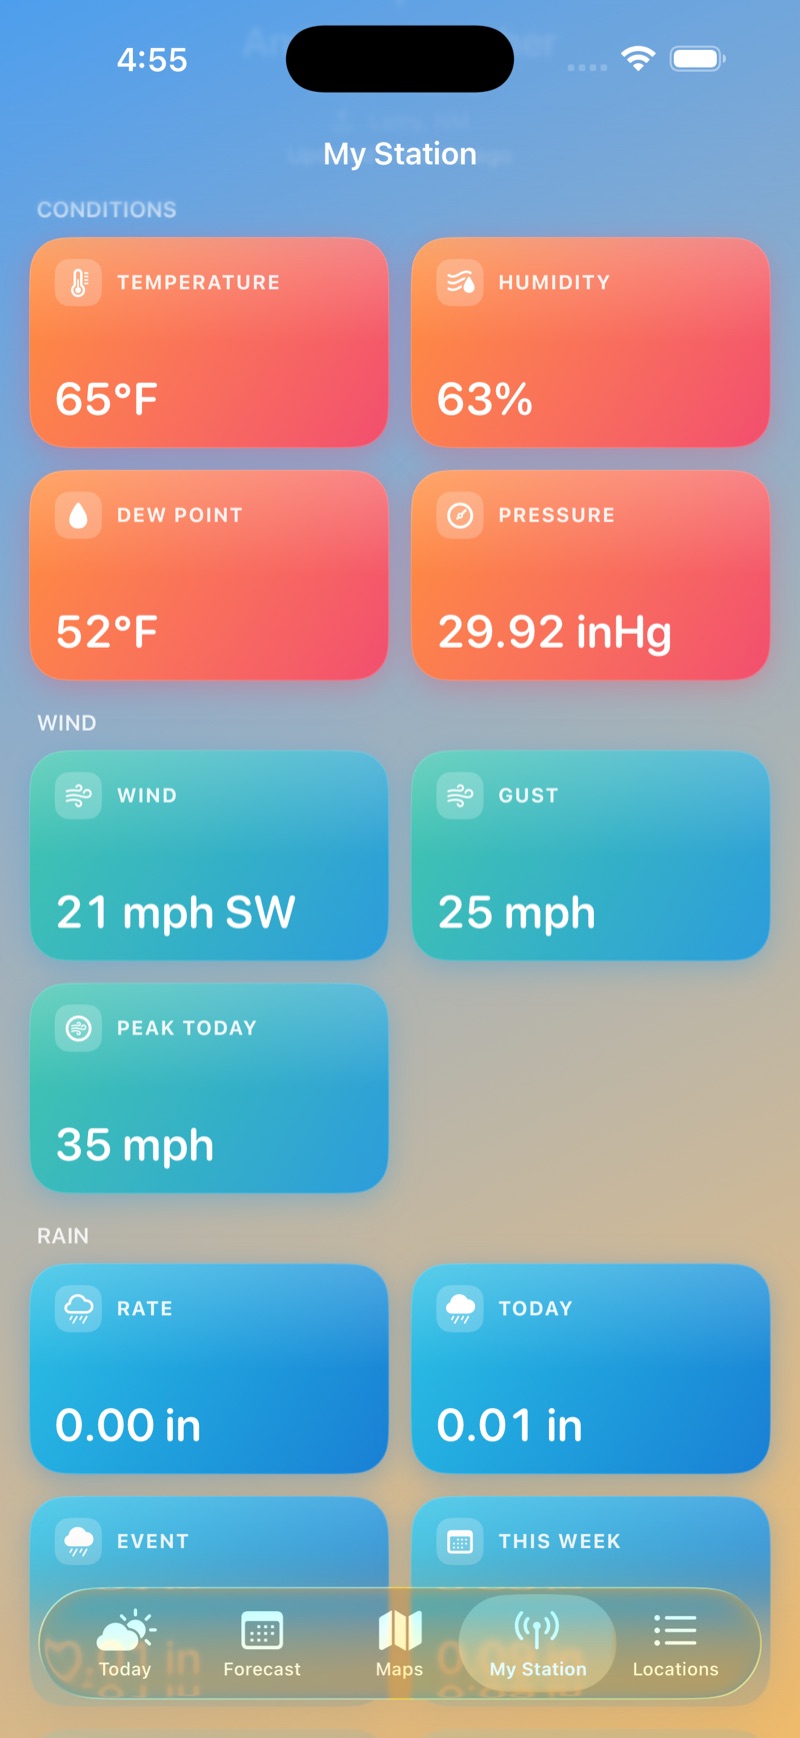
If you own a backyard station, Cloudbreak gives it a home on the My Station tab and blends its live readings into your current conditions.
- On the My Station tab, tap Add Weather Station (or go to Settings → Weather Stations).
- Choose a brand: Ambient Weather, Tempest (WeatherFlow), Davis WeatherLink, Netatmo, or PWSWeather. (Ambient is fully supported; the others are in beta.)
- Enter the credentials that brand needs — there's a "How to get your keys" link with step-by-step help for each provider.
- Give it a name (e.g. Home, Cabin) and tap Test connection to confirm it works.
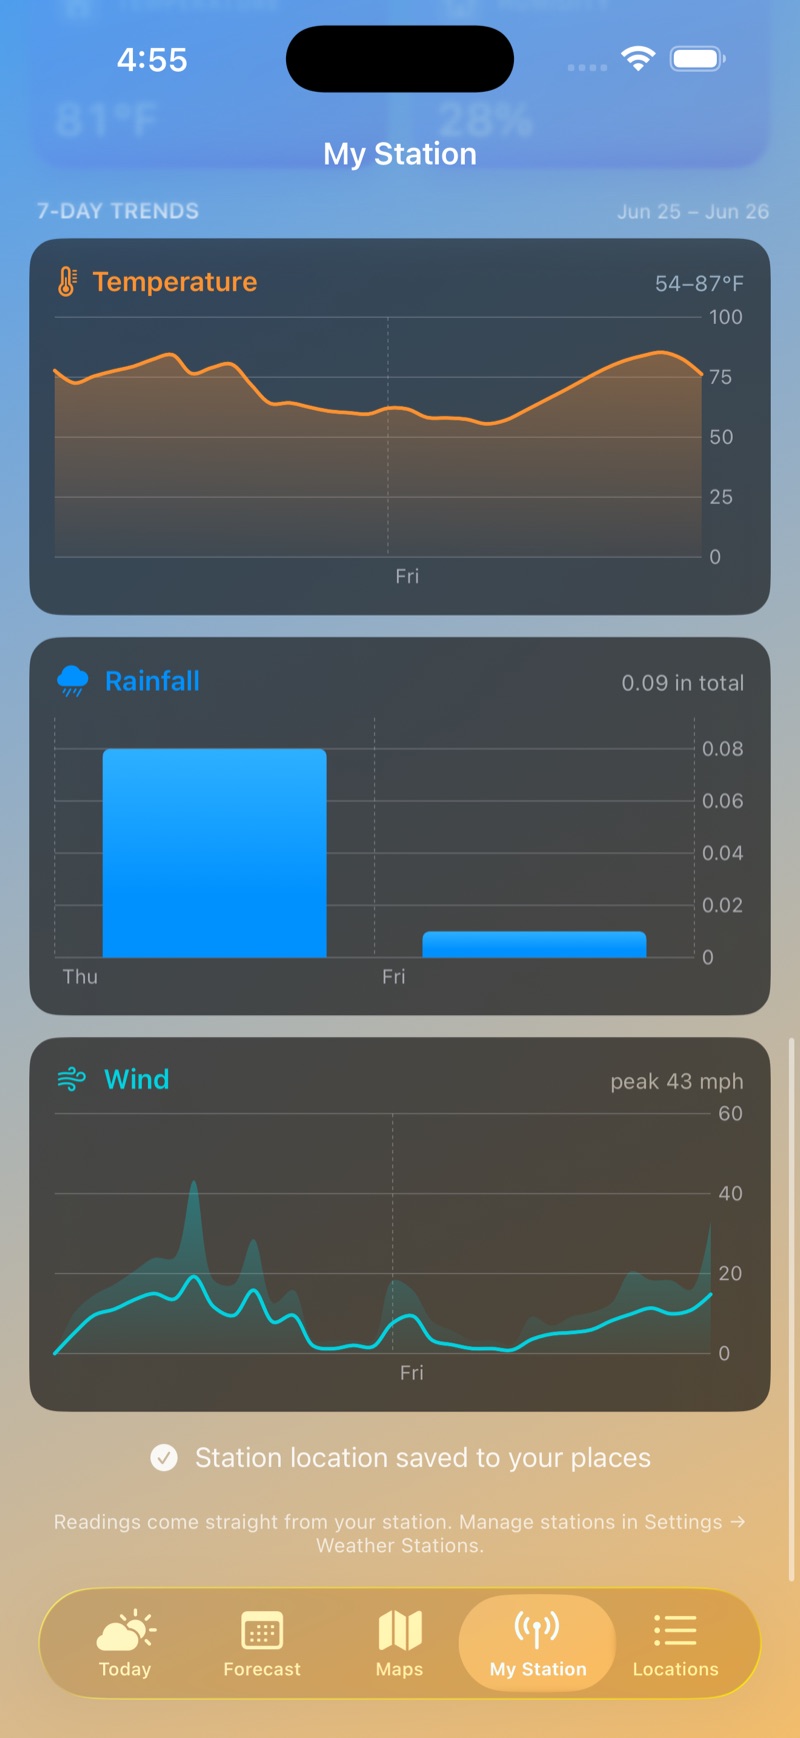
The My Station tab then shows your station's readings grouped into sections — Conditions, Wind, Rain, Sun, Air Quality, Lightning, Indoor — showing only what your hardware reports. Added more than one? Swipe between them. For Ambient stations, a 7-Day Trends section charts temperature, rainfall, and wind over the past week.
Your nearby station (within about 25 miles) blends over the official observation for temperature, humidity, wind, pressure, and dew point, shown with an antenna chip on the Today tab; sky and visibility stay with the National Weather Service, and a reading more than a couple of hours old falls back to official data. To change a station later, open it to pause or Remove it. Your keys are kept in your device's Keychain and are never sent to us; they travel to your other Apple devices through iCloud Keychain, end-to-end encrypted, so a station you add on your iPhone works on your iPad and Mac without retyping anything. Removing a station deletes its keys everywhere at once.
Settings reference
Open Settings from the Locations tab (the gear). Everything it contains:
- Appearance — System, Light, or Dark.
- Your Weather Data → Weather Stations — add and manage personal stations (above).
- Units & Display:
- Temperature — Fahrenheit (°F) or Celsius (°C).
- Wind speed — miles per hour or kilometers per hour.
- Time format — 12-hour or 24-hour.
- Notifications: Fire-weather alerts and Air-quality alerts (both off until you turn them on).
- Data Sources: a transparency list of where everything comes from — forecast (National Weather Service · Open-Meteo), radar (NWS NEXRAD in the U.S. · Environment Canada GeoMet), satellite (NASA GIBS), air quality (EPA AirNow · Open-Meteo), fire & smoke (NASA FIRMS · NIFC · CWFIS in Canada · MTBS · NOAA HMS), lightning (NOAA nowCOAST), history (Open-Meteo), and search & maps (Apple Maps), plus any stations you've added.
- Sync: says whether this device is actually syncing through your iCloud, or keeping its own separate list. It is the only place the app tells you sync is silently off.
- About: the app version and links to the data providers.
Alerts & notifications
- In the app: when the National Weather Service (U.S.) or Environment Canada issues a watch or warning for a location, an alerts banner appears at the top of its Today tab — tap to read the full alert.
- Notifications (off by default): turn on Fire-weather alerts and/or Air-quality alerts in Settings. You'll get a heads-up before the day's fire-weather peak (or when a Red Flag is in effect), or when air quality turns unhealthy, for your primary location. They're computed on your device and delivered locally — no account and no push server. Turn them off any time in Settings or iOS Notifications.
Widgets
Add the Cloudbreak Forecast widget to your Home Screen or Lock Screen. It comes in six sizes — Home Screen small, medium, and large, and Lock Screen circular, rectangular, and inline — showing current conditions, with an hourly strip and the next few days on the larger sizes. It follows the place you last had open in the app — your first saved place is only the fallback before you have opened one — shows an antenna chip when the data is from your station, and opens that place's Today tab when tapped. Fire-weather and air-quality notifications follow the same place.
Across your devices
Cloudbreak is native on every screen. From version 1.3, your saved places, weather stations and unit choices sync between them through your own iCloud — appearance, the alert switches and the map preferences stay on the device you set them on. The version on the App Store today is 1.2, which keeps everything local to each device. The Apple Watch is outside sync either way: it uses its own GPS where it can, and falls back to the place your iPhone is showing.
iPhone
The complete app — all five tabs, the map layers, fire-weather, the almanac, and your stations.
iPad
A true split-view: a sidebar of your places beside a detail pane carrying the Today, Forecast, Maps, and My Station views — not a stretched-up iPhone screen.
Apple Watch
Four pages — Current, Hourly, 7-Day, and Fire & Air — plus Conditions and Fire Risk complications. It uses the watch's own GPS for where you are (falling back to your iPhone), and shows a severe-weather alert banner when one is active.
Mac
The native Mac app for the full forecast on your desktop. Settings open in a Preferences window, the place switcher sits in the toolbar, and widgets live in Notification Center.
Tips & gestures
- On Today, swipe left/right between places, or tap the place name to jump to another.
- Tap the + by the current-location name to save where you are.
- Pull down on the Locations list to refresh.
- Tap a detail card for its 24-hour chart, then drag to scrub through the hours.
- On the Wind map, tap anywhere to inspect that spot. Switch to the Fire layer for active fires, smoke, and burn history, and turn on the AQI overlay on any layer.
- In Locations, swipe a place right to Rename it or left to Remove it; tap Edit to reorder.